Planning is a process of collaboration between stakeholders. During a planning project, it is common to have conflicts in proposed plans. One of the goals in planning is to resolve conflicts and reach a consensus to make decisions. The GeoPlanner application provides a Consensus tool to help you visualize the degree of consensus in land use between multiple plans or scenarios.
Find areas of agreement and disagreement
The GeoPlanner Consensus tool identifies areas of planning consensus and disagreement. The Consensus tool creates an output layer that contains consensus and change scores. This layer and its scores can help planners and designers understand the degree of agreement and interest for change within a project area. The consensus output layer is rendered by the consensus score in a color ramp, with deeper red indicating higher disagreement and deeper green indicating more consensus and agreement.
Change score
The change score is computed by dividing the count of features for an area by the total count of participating scenarios. Results are mapped at a 1-to-9 scale. For example, 10 scenarios participate in a consensus process, and 6 out of 10 scenarios cover the interested area. The change score is computed as 6 divided by 10, which is 0.6. This score is then mapped to a 1-to-9 scale, with a final change score of 6.
The change scores should be interpreted on a relative basis. Higher scores indicate more interest to make changes to the area, and lower scores indicate less interest to make changes among all the proposed plans or scenarios.
Consensus score
When calculating consensus scores, the Consensus tool makes use of the attribute that denotes feature types. For example, a land-use type field is used to denote whether land is residential, commercial, industrial, or agricultural. Symbols for different feature types are assigned based on the same field before the feature service is published. The Consensus tool uses this field to compute consensus scores.
- When the feature type field is a text field, the consensus score is computed by dividing the count of the feature type that occurs the most by the total count of features for the geometry and mapping the result to a 1-to-9 scale. For example, there are 10 scenarios participating in the finding consensus process, and 6 out of 10 scenarios cover the interested area, and the feature types from the 6 scenarios are agricultural, agricultural, residential, park, commercial, and agricultural, respectively. In this case, agricultural is the feature type that occurs the most and its count is 3, and the total count of features for the interested area is 6 because the other 4 scenarios do not cover this area. The consensus score is first computed as 3 divided by 6, which is 0.5, and then mapped to a 1-to-9 scale, with a final consensus score of 5.
- When the feature type field is a numeric field, the consensus score for a geometry is computed differently. The numeric feature type field is usually used in suitability layers that can also be used as scenario layers. The GeoPlanner application requires that such suitability layers be preclassified and that a numeric field be used to indicate the rank of suitability. The field value must range from 1 to 9. In this case, the consensus scores are computed by dividing the sum of the field values by the total count of features for that geometry and mapping the result to a 1-to-9 scale. For example, there are 10 scenarios participating in the finding consensus process, 6 out of 10 scenarios cover the interested area, and the field values are 6, 7, 7, 8, 7, and 9, respectively. The consensus score is first computed as the sum of (6, 7, 7, 8, 7, and 9) divided by 6, which is 7.3, and mapped to a 1-to-9 scale, with a final consensus score of 7.
The consensus scores should be interpreted on a relative basis. Higher scores indicate more agreement, and lower scores indicate less agreement.
Consensus tool
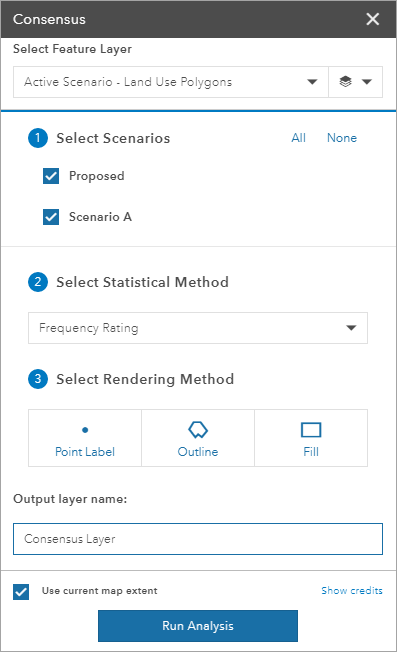
Here's how to use the consensus tool:
- On the application toolbar, click Evaluate.
- Click Consensus to display the Consensus tool.
- Select one polygon feature layer from the drop-down list of feature layers.
Only polygon layers are listed.
- Optionally, click the Feature Type Filter button and select one or more subtypes.
- Check or uncheck the participating scenarios.
- Identify which statistical method to use.
- Select a rendering method.
- Provide a name for the output layer.
- Check or uncheck the option to use the current map extent.
- Click Run Analysis.

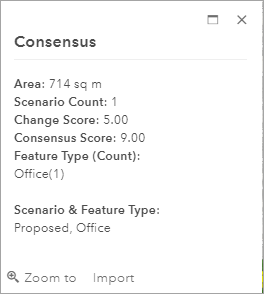
Once the process is completed, the result layer is automatically added to the current project map. It is also automatically shared to the project team and is appropriately tagged for future data search purposes. The status of this process is tracked on the Jobs tab in the Contents window. You can also identify a consensus feature to display a consensus score, change score, scenario count, feature type, and other information in an attribute pop-up.
